Understanding the Dashboard
Main Widget Overview
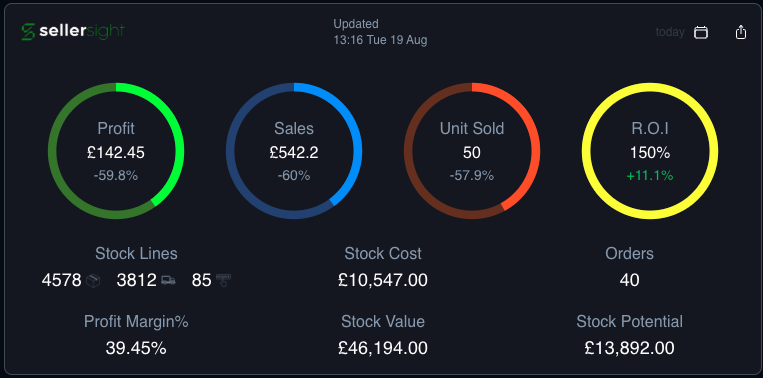
The Main Widget gives you a quick snapshot of your business performance. By default, it shows data for today, but you can use the dropdown menu to switch to other timeframes such as: Yesterday, Month To Date, Last 7 Days, Last 30 Days etc.
What you’ll see;
The widget highlights key performance metrics:
Profit – total profit within the selected period
Sales – revenue from your orders
Units Sold – number of items sold
ROI – return on investment
It also provides additional insights:
FBA Stock – broken down into In Stock, Inbound, and Reserved
Stock Cost – your total investment in FBA inventory
Orders – number of orders during the selected period
Profit Margin % – profitability ratio for the time period
Stock Value – the current market value of your entire FBA inventory
Potential Profit – projected profit if all current stock sells at the listed price
Share Your Stats – Click Share to generate a static image of your figures. Perfect for posting on social media or Discord. Sensitive information is automatically hidden.
Switch Views – Use the rings icon to toggle between percentages (%) and currency (£) to compare data in the format you prefer.
Last Orders
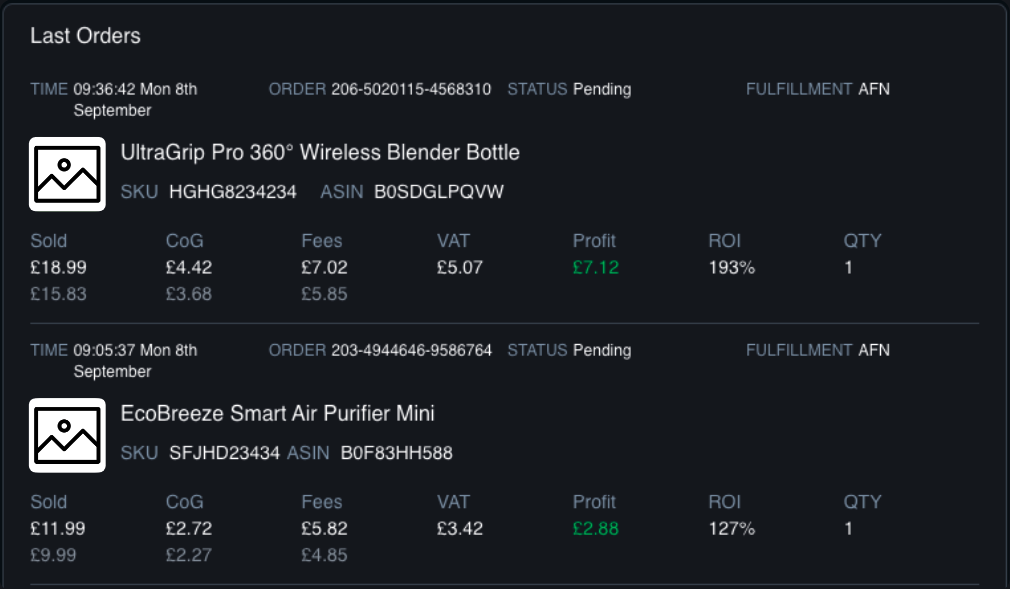
Last Orders Widget — Field Guide
Time – When the order was placed.
Order – The unique Amazon order number.
Status – Shows the order’s progress: Pending, Unshipped, Shipped, or Cancelled.
Fulfillment – Indicates who fulfilled the order:
AFN = Fulfilled by Amazon
MFN = Fulfilled by you (the seller)
Sold – The item’s sale price. For Pending orders, this is an estimated figure (Amazon confirms the actual price once the order moves to Unshipped).
COG – Your recorded Cost of Goods for the item.
Fees – Amazon’s combined FBA and referral fees.
VAT – Value Added Tax applied to the order (if applicable).
Profit – Your estimated earnings for the order.
ROI – Return on Investment, shown as a percentage.
QTY – The number of units purchased in the order.
Sales History
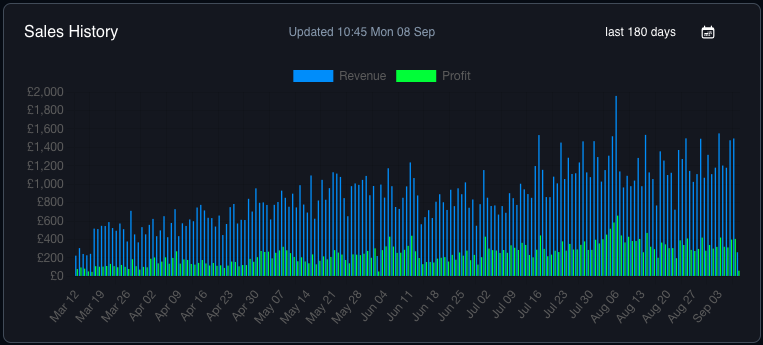
The Sales History graph gives you a clear view of your Revenue and Profit over time. Use the built-in date filters – including custom ranges – to quickly spot trends, compare performance, and track your business growth at a glance.
Best Sellers
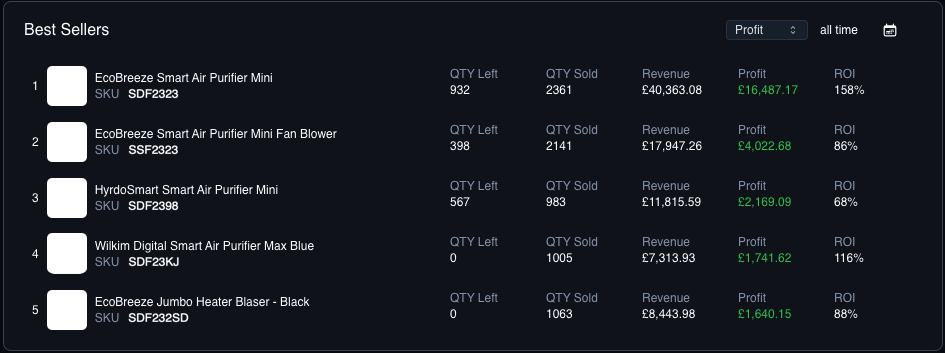
The Best Sellers widget highlights your top 5 products for the selected period, ranked by Profit, Revenue, or Quantity Sold. It’s a quick way to see which items are driving your business forward.
QTY Left – Your remaining FBA stock for the item.
QTY Sold – The number of units sold while tracked in SellerSight.
Revenue – The total revenue generated from the units sold.
Profit – Your earnings after costs and fees for those sales.
ROI – Your estimated return on investment, shown as a percentage.
Repricer Widget
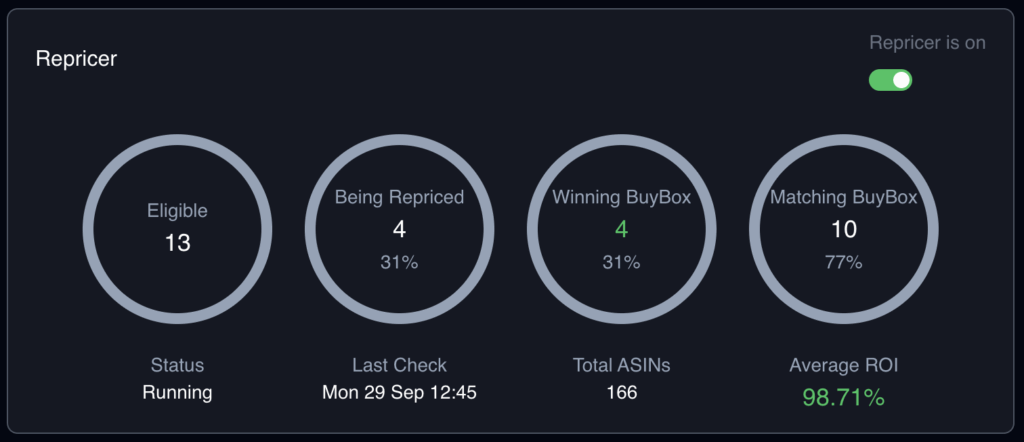
The Repricer widget gives you a real-time view of how your automated pricing is performing. It shows which of your products are eligible for repricing, how many are actively being updated, and whether you’re winning or matching the Buy Box – all while keeping an eye on your overall profitability.
Eligible – The number of products that meet the criteria for repricing and are ready to be adjusted.
Being Repriced – How many of your eligible products are currently having their prices updated by the repricer.
Winning BuyBox – The number of your listings that are currently holding the Buy Box, giving you the best chance of making a sale.
Matching BuyBox – Products priced at the Buy Box level, keeping you competitive even if you’re not currently the winner.
Status – Shows whether your repricer is running and actively monitoring prices.
Last Check – The most recent time Sellersight scanned and repriced your listings.
Total ASINs – The total number of products you’re tracking in your Sellersight account.
Average ROI – Your average return on investment across all repriced items, helping you balance competitiveness with profitability.
Inventory Report
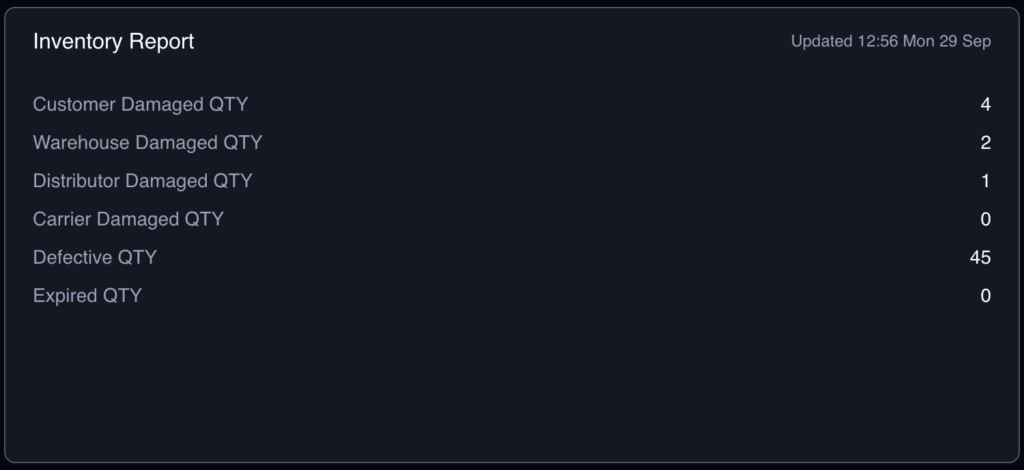
The Inventory Report widget highlights any stock that’s unsellable due to damage, defects, or expiration. It’s a quick way to see where you may be losing value in your supply chain and to spot opportunities for reimbursements or returns.
Customer Damaged QTY – Items returned by customers that arrived damaged and cannot be resold.
Warehouse Damaged QTY – Stock that was damaged while stored in the fulfillment warehouse.
Distributor Damaged QTY – Products received from your supplier or distributor in a damaged condition.
Carrier Damaged QTY – Units damaged in transit by the shipping carrier before reaching the warehouse or customer.
Defective QTY – Items marked as faulty due to quality or manufacturing issues.
Expired QTY – Products that have passed their expiration date and can no longer be sold.
Profit & Loss
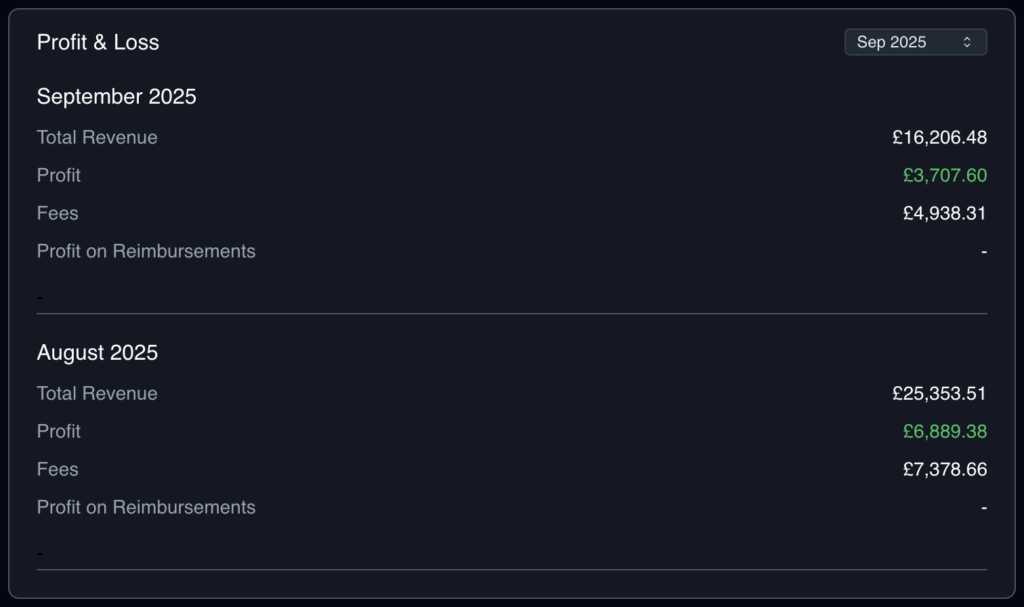
The Profit & Loss widget gives you a month-by-month breakdown of your business performance. It shows your revenue, profit, fees, and any gains from reimbursements, so you can see exactly how much you’re making after costs.
Total Revenue – The total sales value of all products sold during the selected month.
Profit – Your net earnings after deducting costs and marketplace fees.
Fees – The total marketplace charges (such as referral, FBA, and transaction fees) applied during the period.
Profit on Reimbursements – Any additional profit generated from reimbursements, such as refunds from Amazon for damaged or lost stock.
This widget makes it easy to compare performance across months and quickly spot trends in your revenue, profit, and costs.
Automated Feedback
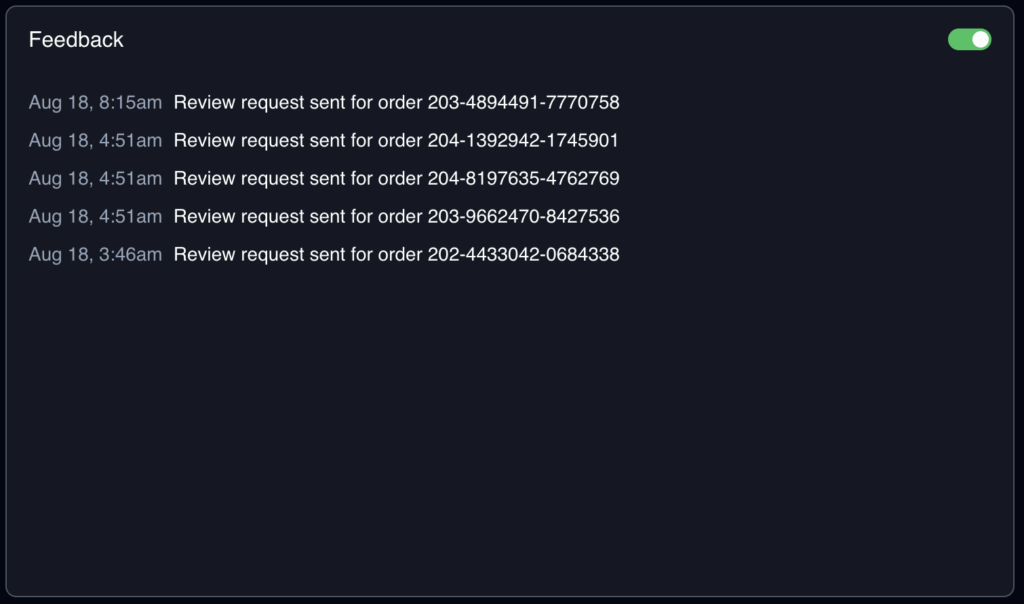
The Feedback widget shows the automated review requests sent for your recent orders. It’s an easy way to confirm that Sellersight is reaching out to customers on your behalf and helping you build stronger seller ratings.
Timestamp – The exact date and time the feedback request was sent.
Order Reference – The order ID the review request was linked to.
Automation Status – The toggle in the top-right corner shows whether automated feedback requests are currently active.
By automating review requests, you save time, stay compliant with marketplace rules, and steadily increase your chances of gaining more positive reviews.
Fees
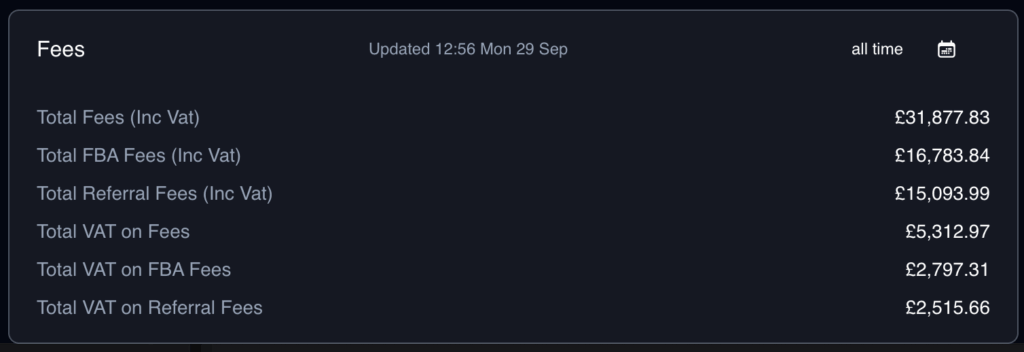
The Fees widget gives you a detailed breakdown of all marketplace charges, so you can see exactly how much you’re paying in selling costs and VAT. This helps you stay on top of expenses and understand how fees impact your profitability.
Total Fees (Inc VAT) – The overall amount paid in marketplace fees, including VAT.
Total FBA Fees (Inc VAT) – Fulfilment by Amazon (FBA) charges for storage, picking, packing, and shipping orders.
Total Referral Fees (Inc VAT) – The commission charged by the marketplace on each sale.
Total VAT on Fees – The total VAT you’ve paid across all fees.
Total VAT on FBA Fees – The VAT portion specifically related to your FBA costs.
Total VAT on Referral Fees – The VAT portion specifically related to referral fees.
With this widget, you can quickly see where your biggest costs come from and make more informed decisions about pricing and profitability.
